JMF genealogy

Earlier yDNA analysis
Fleming yDNA analysis
Introduction An analysis of this Fleming family's yDNA was undertaken several years ago by Relative Genetics.
Results Interpretation Match with William Robert Fleming
Over time, many mutations in human DNA have occurred. The Y-chromosome, whose presence means that the person is male, has picked up mutations as time has passed. Part of the Y chromosome information is, however, passed largely unchanged from father to son. This inheritance pattern reflects the passing of the surname along the male line, a practice that is common to many cultures. Therefore, it is useful in discovering clues about one’s paternal line.
Match with William Robert Fleming, USA
The results of the analysis of this Fleming family's DNA were compared to other results on file. A 100% match was found with William Robert (Bill) Fleming of Missouri USA (born in Kansas). That is, we match on 26 locations out of the 26 on Bill's Y-chromosome analysis. The DNA statistical experts say that this means we certainly share a fairly recent common ancestor. In fact, they say that there is a 50% likelihood that the common ancestor is 5 generations back (i.e. our GGG-Grandfather) or less. There is an 85% chance that the common ancestor is 15 generations back or less and a 95% likelihood that the common ancestor is less than 30 generations back.
I am currently working with Bill to identify our common ancestor. His known ancestry is detailed on his website. The table below summarises what we know.
| Bill's USA/Scotland line | My Australia/Scotland line | |||||||
| Gen. | Name | Born | Where | Died | Person | Birth | Place | Death |
| 1 | James Michael F | 1955 | Bourke, NSW | |||||
| 2 | William Robert F | 1940 | Reginald Bruce F | 1929 | Young, NSW | |||
| 3 | Donald Andrew F | 1911 | Cuba, Kansas | 1981 | Reginald Angus F | 1908 | Orange, NSW | 1984 |
| 4 | Robert Crawford F | 1871 | Kilmarnock, Scotland | 1956 | Charles Taylor F | 1878 | Glasgow, Scotland | 1937 |
| 5 | William F | 1849 | Hamilton, Scotland | 1916 | Charles F | 1854 | Coatbridge, Scotland | 1928 |
| 6 | Robert F | 1823 | East Kilbride, Scotland | 1883 | Angus F | 1831 | Cambuslang, Scotland | 1882 |
| 7 | Wlliam F | 1796 | East Kilbride, Scotland | Angus F | 1799 | Govan, Scotland | ||
| 8 | David F | 1770 | East Kilbride, Scotland | |||||
Table summarising both paternal ancestral lines
 Right: Map of South-West Scotland. Birthplaces mentioned in the above table are circled.
We can both go back at least 7 generations but this does not, unfortunately, reveal the common ancestor. Let's hope we don't have to go back 15 generations to find him! It is very difficult to find reliable information about births, deaths and marriages prior to 1800.
It seems that we are close, as both lines are converging on the adjoining Scottish Counties of Lanarkshire and Ayrshire. The map at right shows all of the birthplaces mentioned in the above table (circled).
Y-Results for Fleming
Case Number: T039988
|
|
|
|
|
|
|
|
|
|
|
|
|
|
|
|
|
|
|
|
|
| 14 | - | 11 | 14 | 12 | 14 | 30 | 23 | 10 | 13 | 13 | 12 | 16 | 12 | 12 | 14 | 12 | 12 | 12 | 13 |
|
|
|
|
|
|
|
|
|
|
|
|
|
|
|
|
|
|
|
|
|
| 25 | 19 | 29 | 12 | 11 | 11 | 15 | 16 | 10 | 10 | 11 | 12 | 11 | 22 | 15 | 16 | 17 | 17 | - | - |
|
|
|
|
|
|
|
||||||||||||||
| 23 | 10 | 19 | 23 | 13 | 12 |
Each of the names of the Y chromosome (Ycs) locations (loci) above represent an allele. An allele is any one of a number of viable DNA codes of the same gene (sometimes the term refers to a non-gene sequence) occupying a given locus (position) on a chromosome. An individual's genotype for that gene will be the set of alleles it happens to possess. This test yields up to 46 allele values. However, DYS 19b, DYS 464e, and DYS 464f are very rare in nature and most people do not have a value at these locations.
A dash, "-", shown in specific boxes in the chart above means that results were not produced for that particular locus based on one of 2 situations. First, as previously indicated, in the cases of DYS19b, DYS464e and DYS464f, a lack of result may be due to the fact that these allele results are very rare in nature. Second, in other situations, the dash may signify the presence of a null allele, or an allele value that cannot be amplified or obtained using the current testing methodology. Null allele values are generally caused by a mutation at a specific DNA position within the region being tested. This mutation renders the locus uninformative under the testing conditions employed by the laboratory.
Interpretation
Paternal line analysis is used to establish the genetic profile (haplotype) of deceased ancestors along one's direct paternal line (as indicated by the blue line in the pedigree image at right). This haplotype can give you hints to the ancient origins of you paternal ancestors. The haplotype can be used to determine what haplogroup these paternal ancestors belonged to. Genealogists can use this technology to gain some insight into the very ’deep’ ancestry – i.e. thousands of years ago – of their direct paternal ancestors.
As man has migrated around the world over time, these haplogroups can be used to trace their paths. Haplogroups can be thought of as branches of the Y-chromosome genetic tree. This is incredibly useful and is an extra tool used alongside archaeological and linguistic data.
The above DNA analysis is consistent with haplogroup R1b. Haplogroup R1b, defined by the SNP marker M343, is part of the ancestral R1-M173 of which ancestors first arrived in Europe from West Asia during the Upper Paleolithic period (35,000-40,000 years ago) at the beginning of the Aurignacian culture. This culture is one of the first within Europe to leave cave-art and their stone tools were more refined than previous periods. The Périgordian culture is also considered by some to have existed at this time.
As the last ice-age began, it became necessary for our ancestors to move south of the tree-line to hunt game. At its peak, the ice shelf within Europe extended as far south as southern Ireland, the middle of England and across northern Germany. Scandinavia was entirely covered. The sea-ice pack extended as far as northern Spain and tundra covered much of continental Europe. The tree-line at the height of the ice-age was as far south as Southern France, Northern Italy, north of the Balkans and across the Black Sea. The air would have been on average 10-12 degrees cooler and much more arid. In between the ice and the tree line, drought-tolerant grasses and dunes would have dominated the landscape.
The Neanderthals died out around 14,000 years ago leaving the nomadic hunter-gatherer Cro-Magnon (modern man) to pursue the animals of the time. Due to the cold and the need for food, the populations of the day waited the ice age out in the three locations. These were the Iberian Peninsula, the Balkans and the Ukraine. During this period, the mutation which defines R1b (M343) likely developed within the Iberian Peninsula.
As the ice-age ended and the fauna and flora were able to move northward again, people in R1b also migrated north.
The three groups of humans had taken refuge for so long that their DNA had naturally picked up mutations, and consequently can be defined into different haplogroups. As they spread from these refuges, Haplogroups R1b, I and R1a propagated across Europe.
- Haplogroup I is common across central Europe and up into Scandinavia.
- Haplogroup R1b is the most common haplogroup on the western Atlantic coast, particularly in Spain, Portugal, France, Ireland and the UK.
- Haplogroup R1a is common in eastern Europe and has also spread across into central Asia and as far as India and Pakistan
These three major haplogroups account for approx 80% of Europe's present-day population.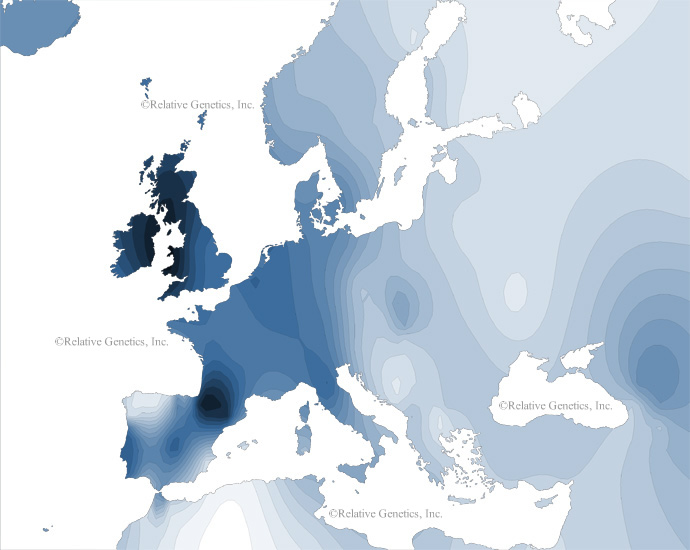
Distribution of Haplogroup R1b